Color scopes for any region of your screen.
SideScopes measures a selected area of the screen and updates live beside the application you are using.
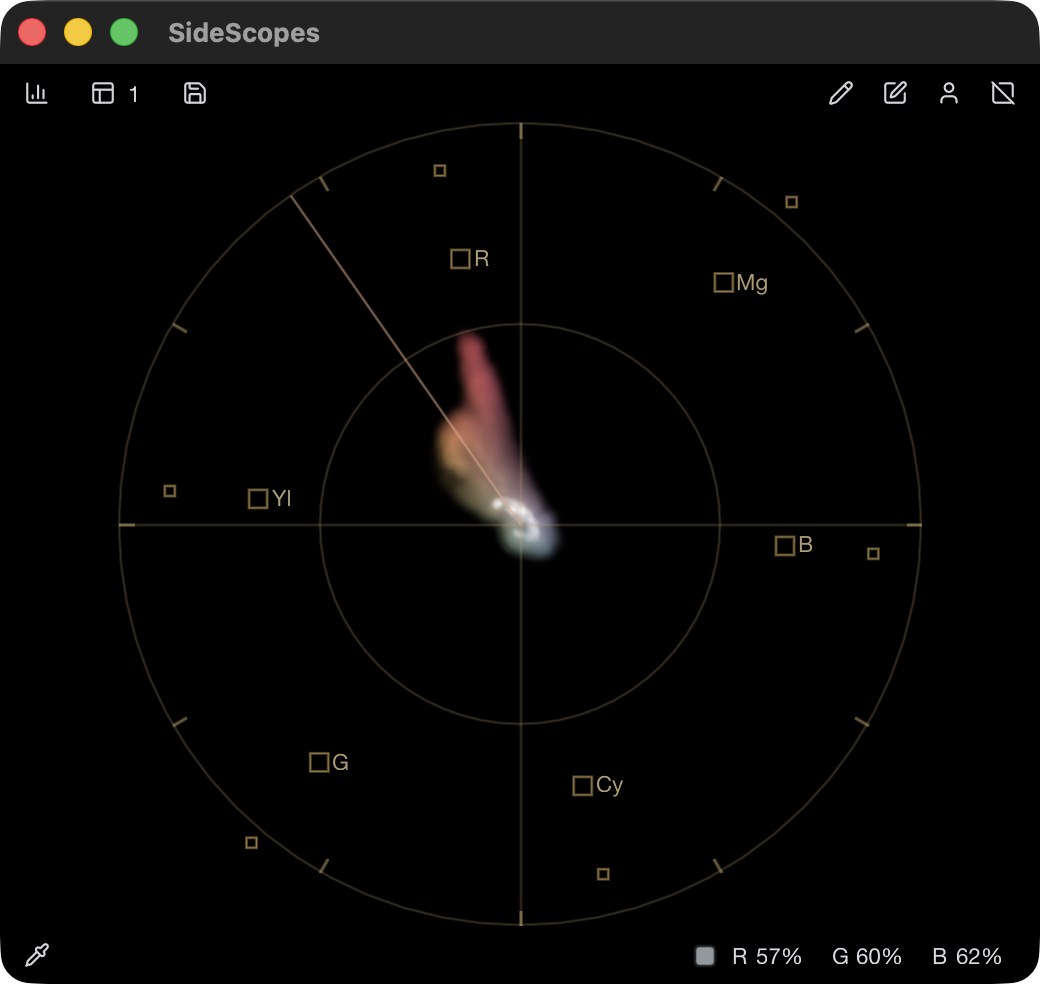
1 Vectorscope
Hue and chroma distribution.
Measure the output you can see
SideScopes analyzes a rectangular area of the composited desktop, so it can work beside grading, editing, viewing, and browser applications without opening their files. The striped editing band shows exactly which pixels feed every visible instrument.
Draw a global region fixed to a display, attach one to a window, or select a detected face to create a window-attached region. Face detection sets its rectangle once; it stays fixed within the window as the image changes. You can move or resize the region, and every active scope measures it at the same time.
1 Global region
Fixed to one display. Its label identifies the display, and windows can move beneath it.
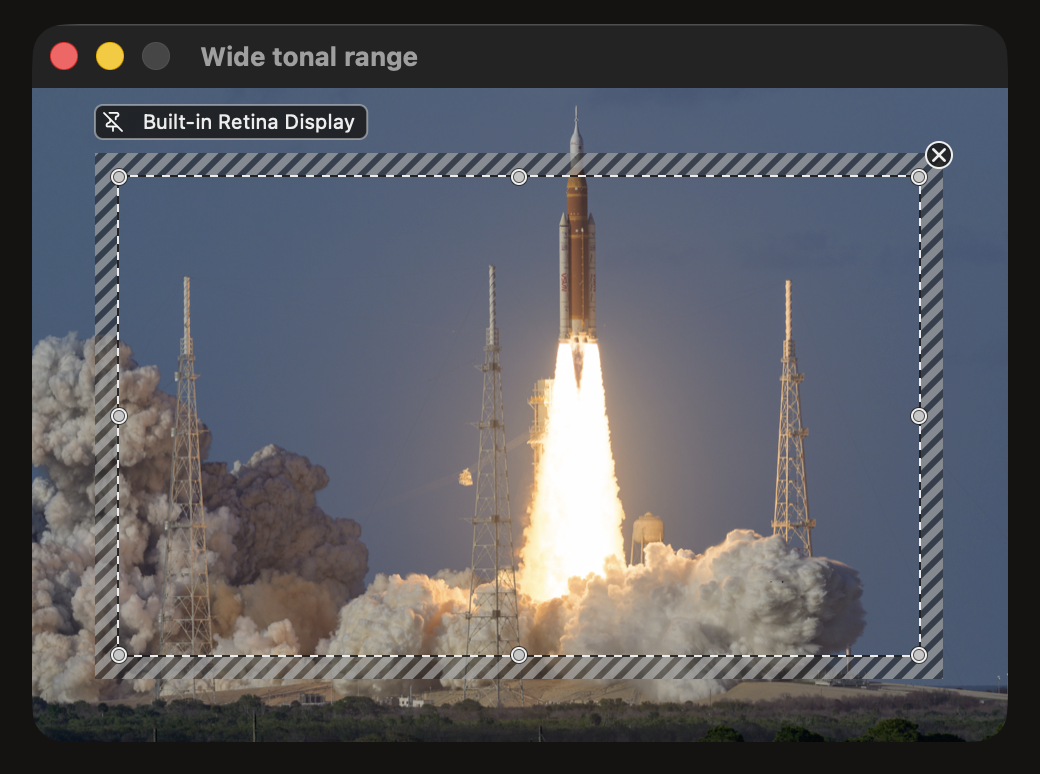
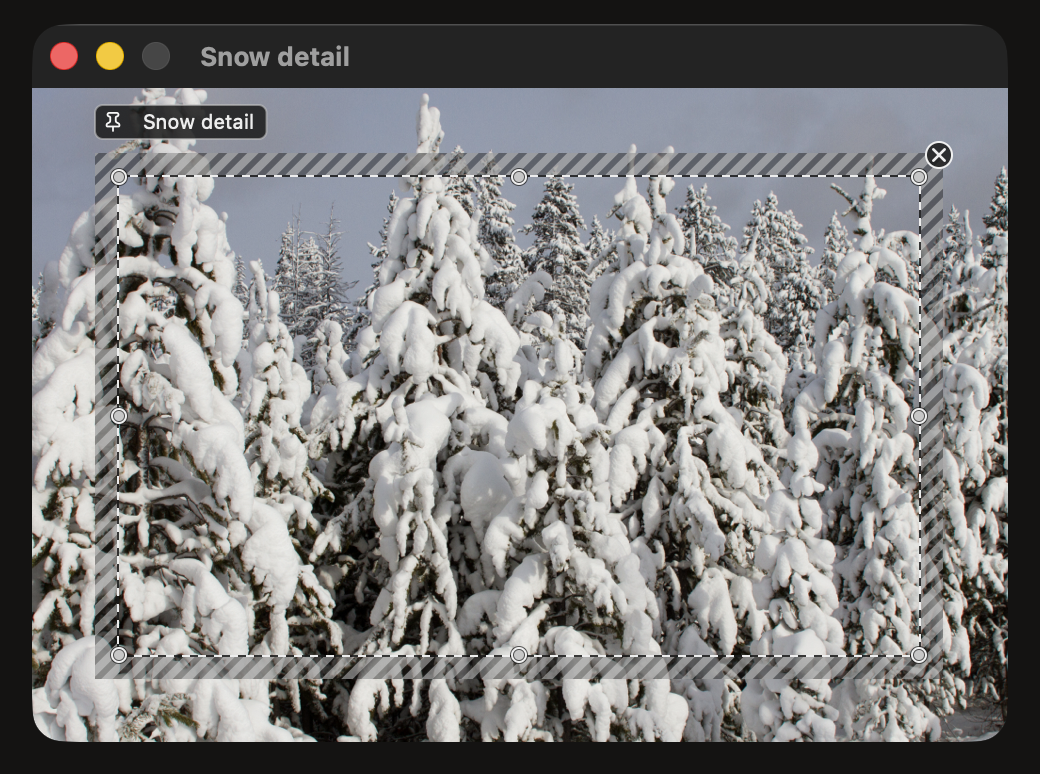
Choose the view that answers the question
Each instrument maps the same selected pixels differently. Use one on its own or combine several in the same window. Each guide explains the axes, interpretation, and limitations.
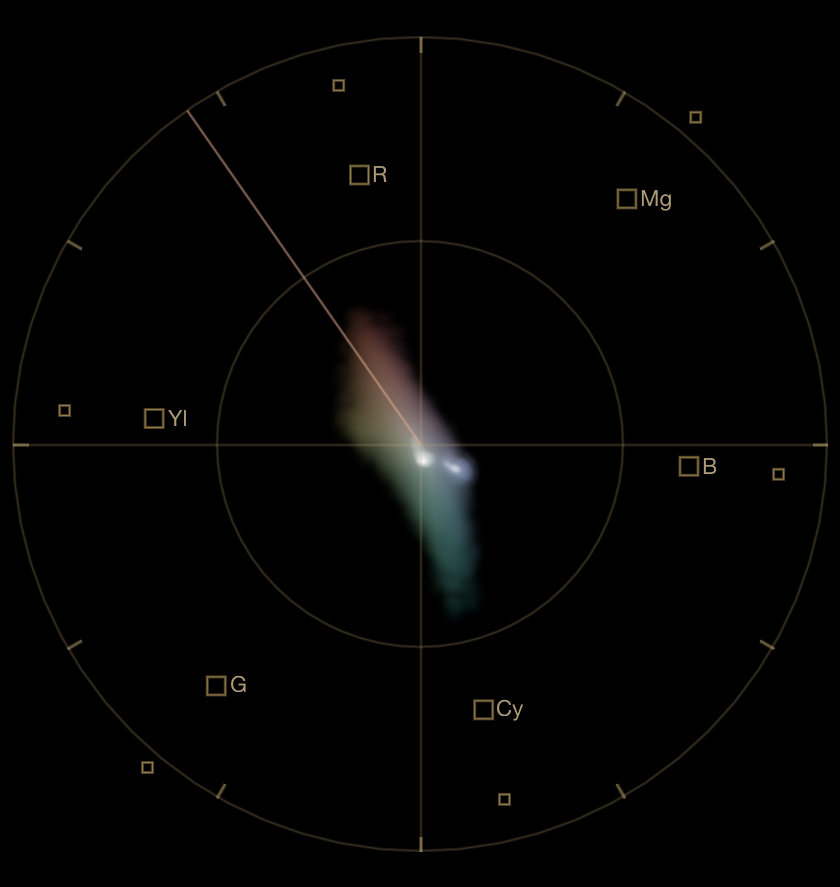
Vectorscope
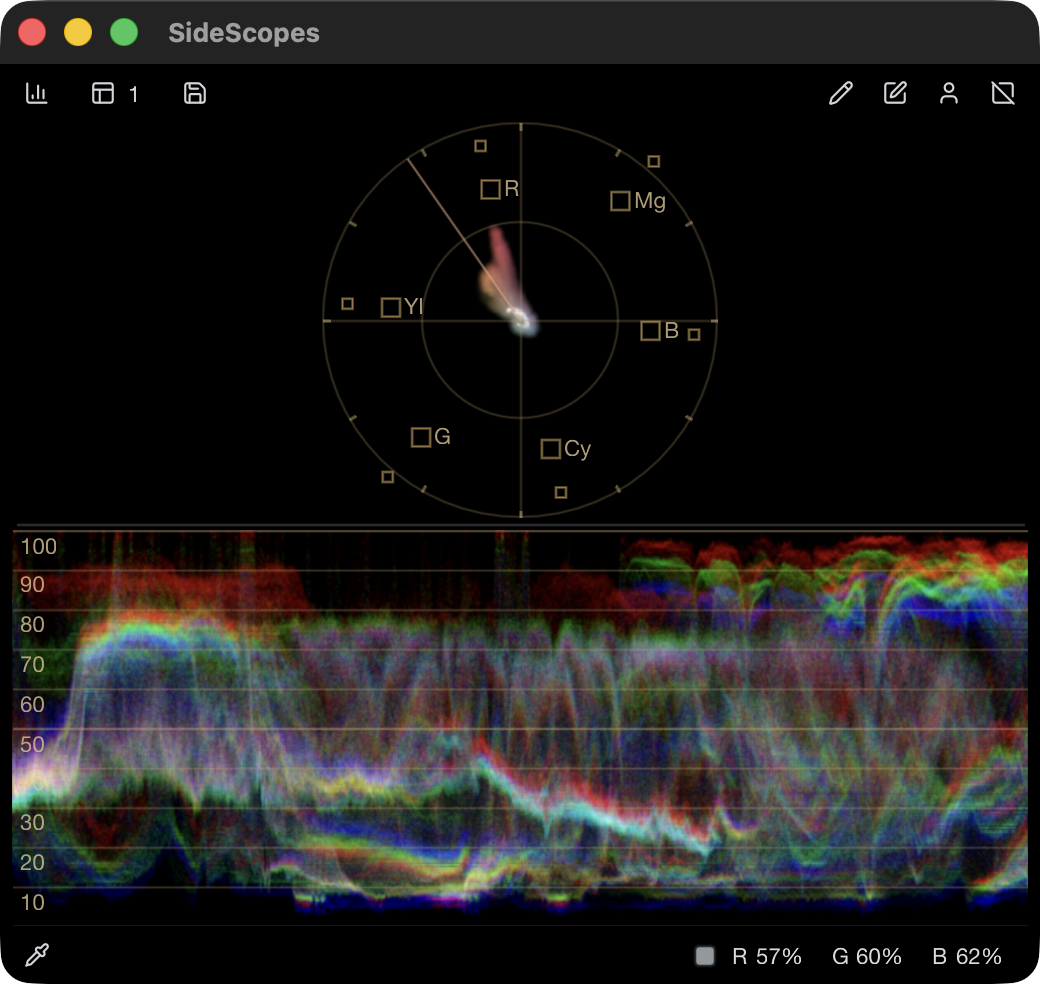
Maps hue by angle and chroma by distance from the center, independently of level and image position.
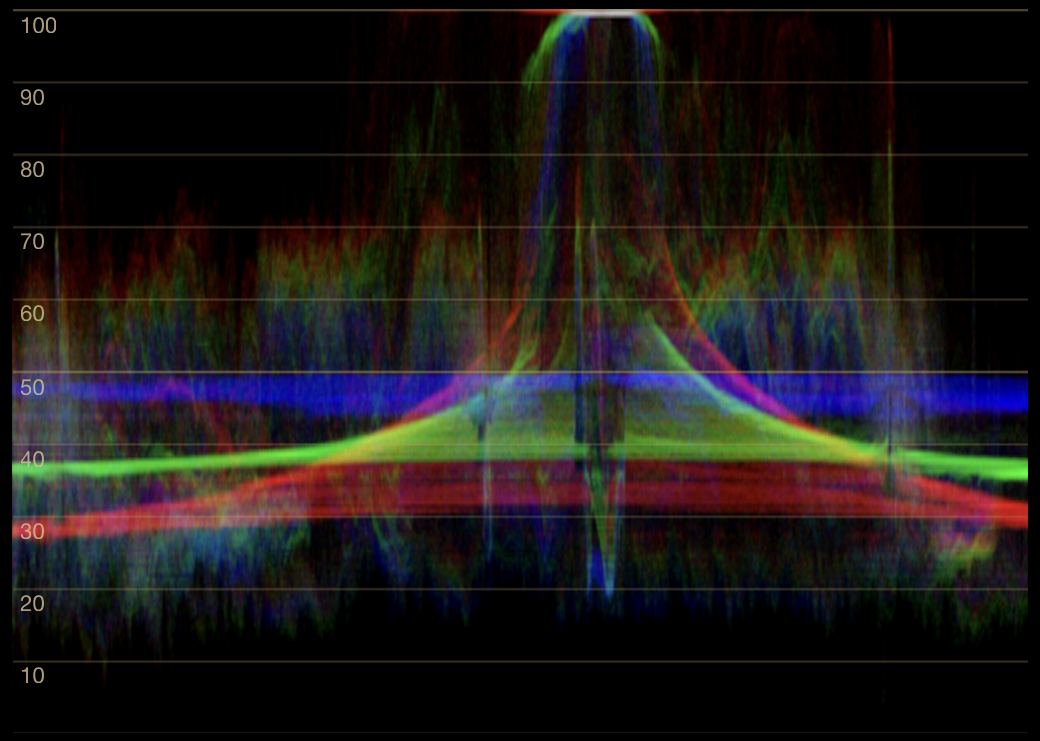
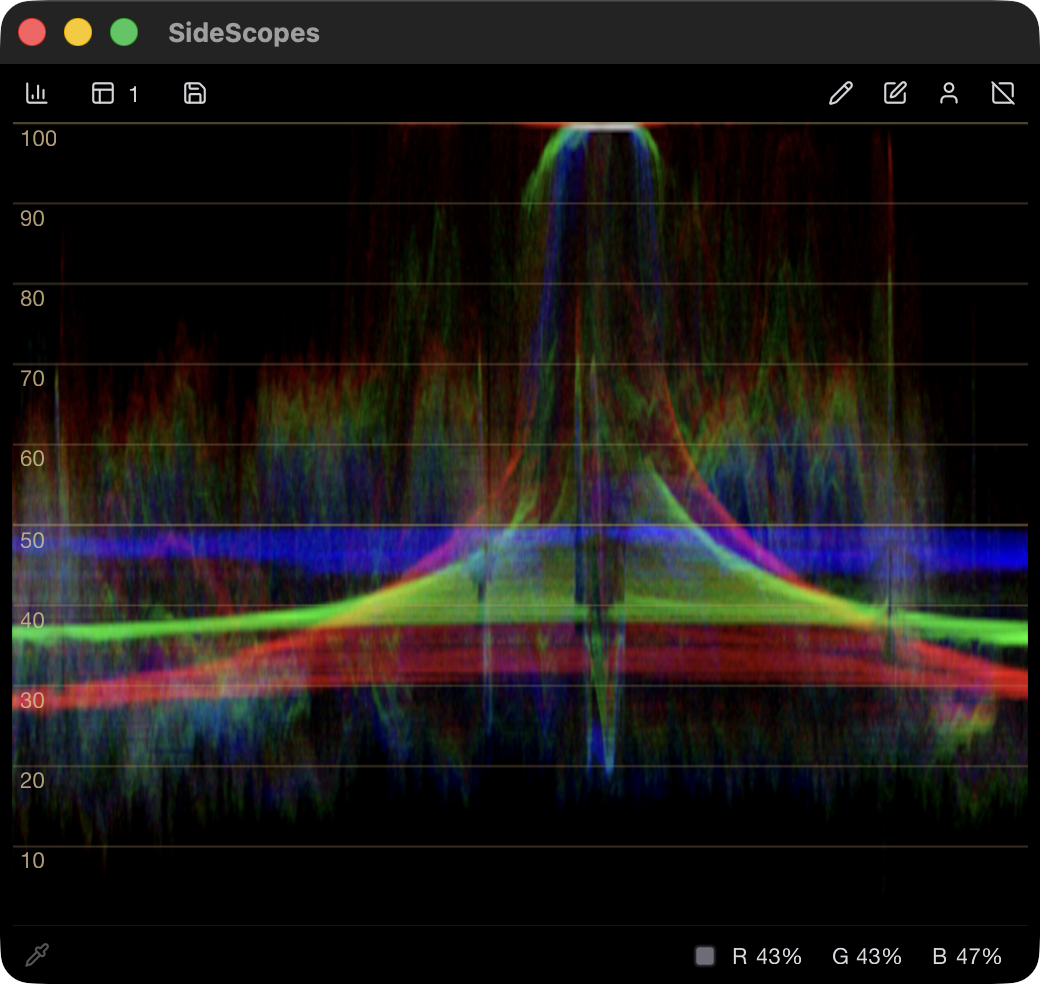
Waveform
Overlays red, green, and blue levels while retaining horizontal image position.
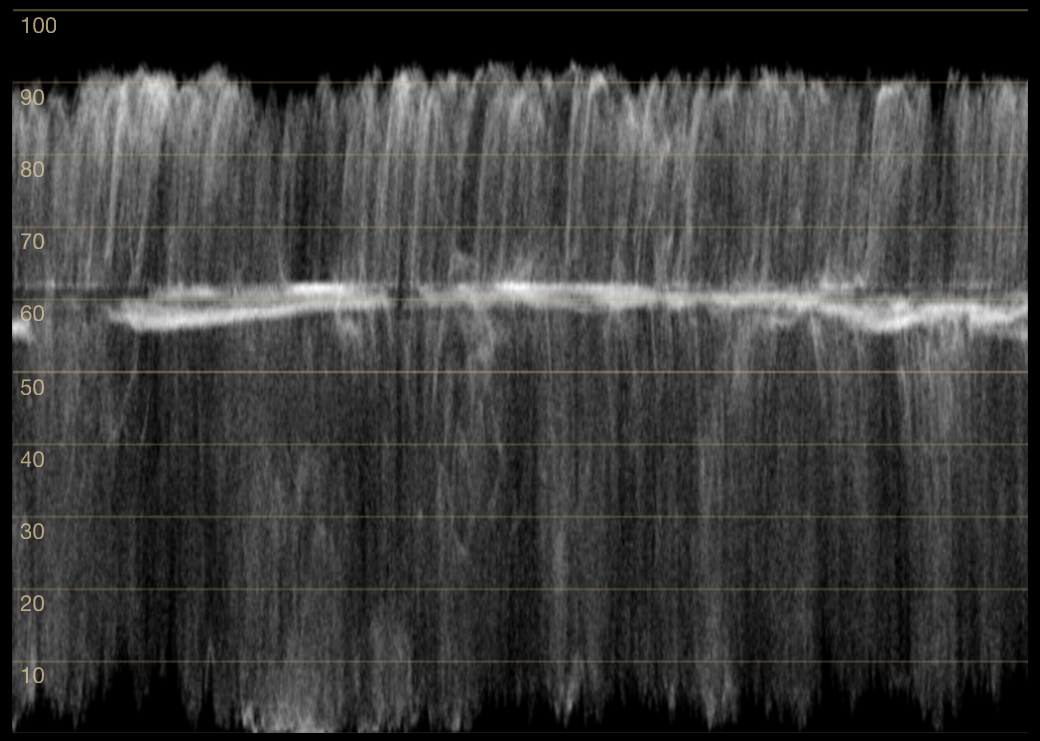
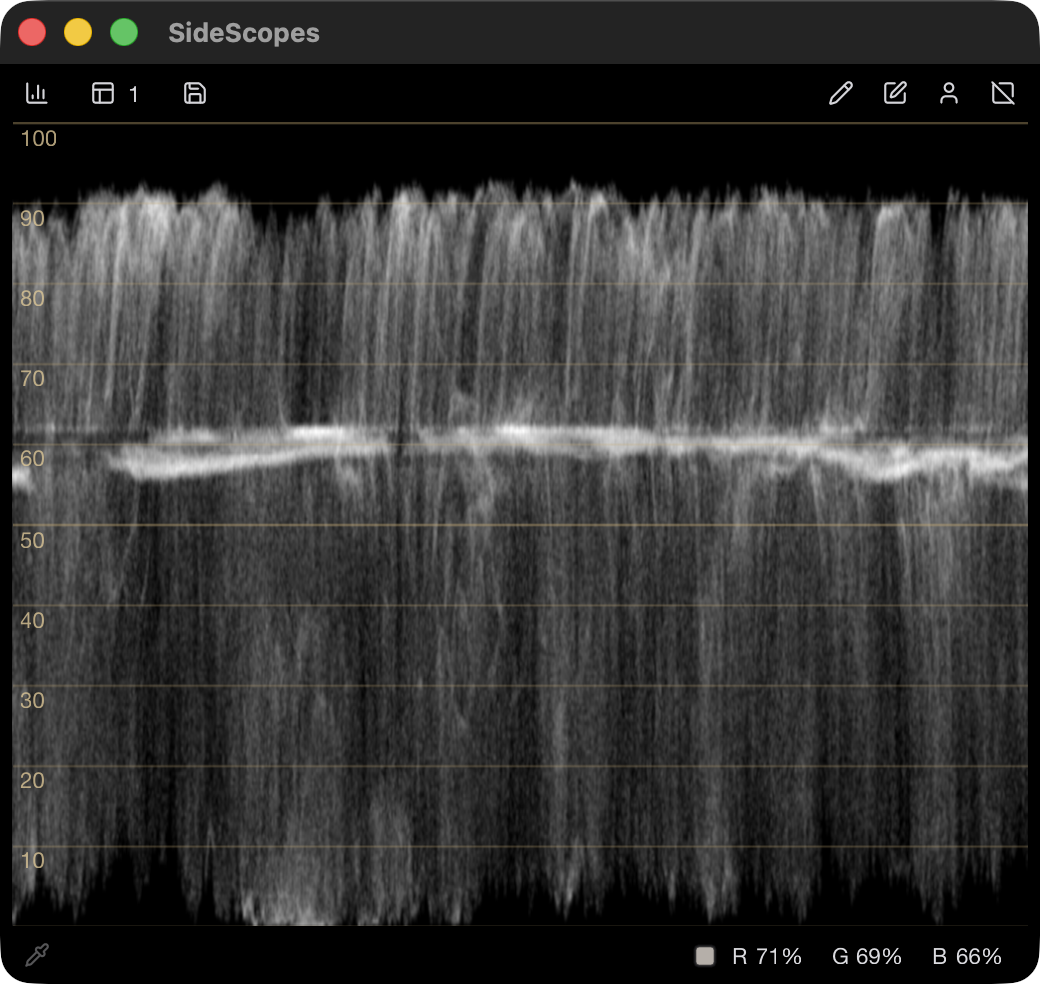
Luma Waveform
Plots one encoded Y′ trace across the region, making rendered level placement easy to locate.
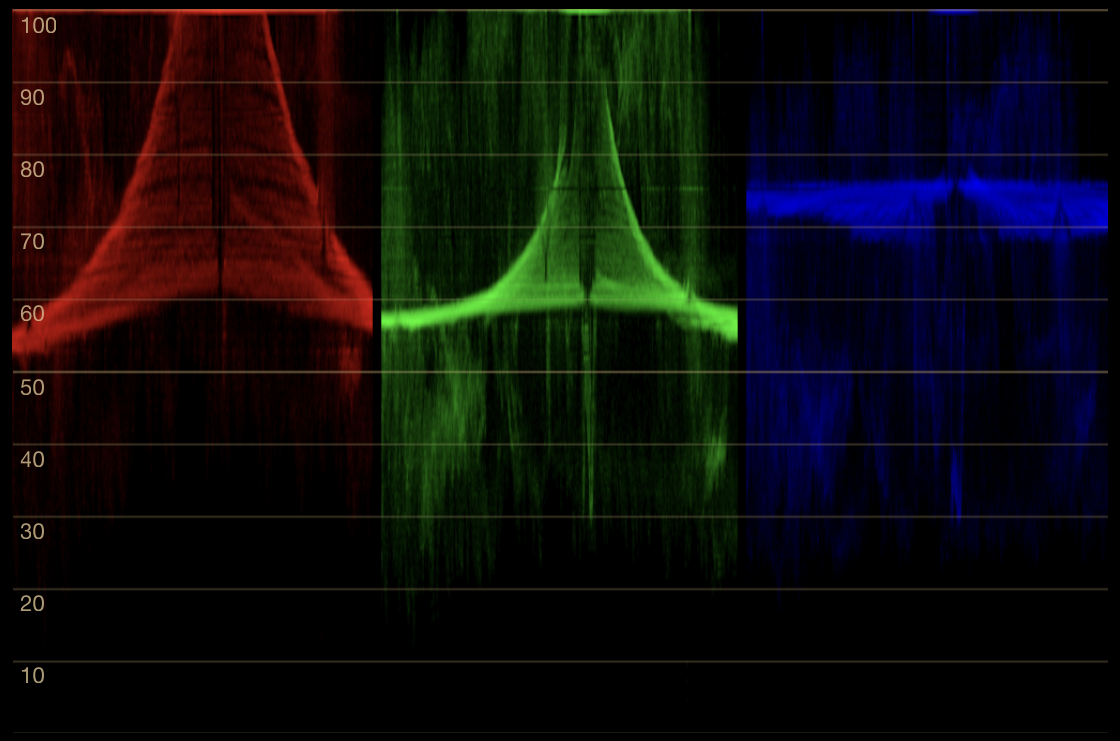
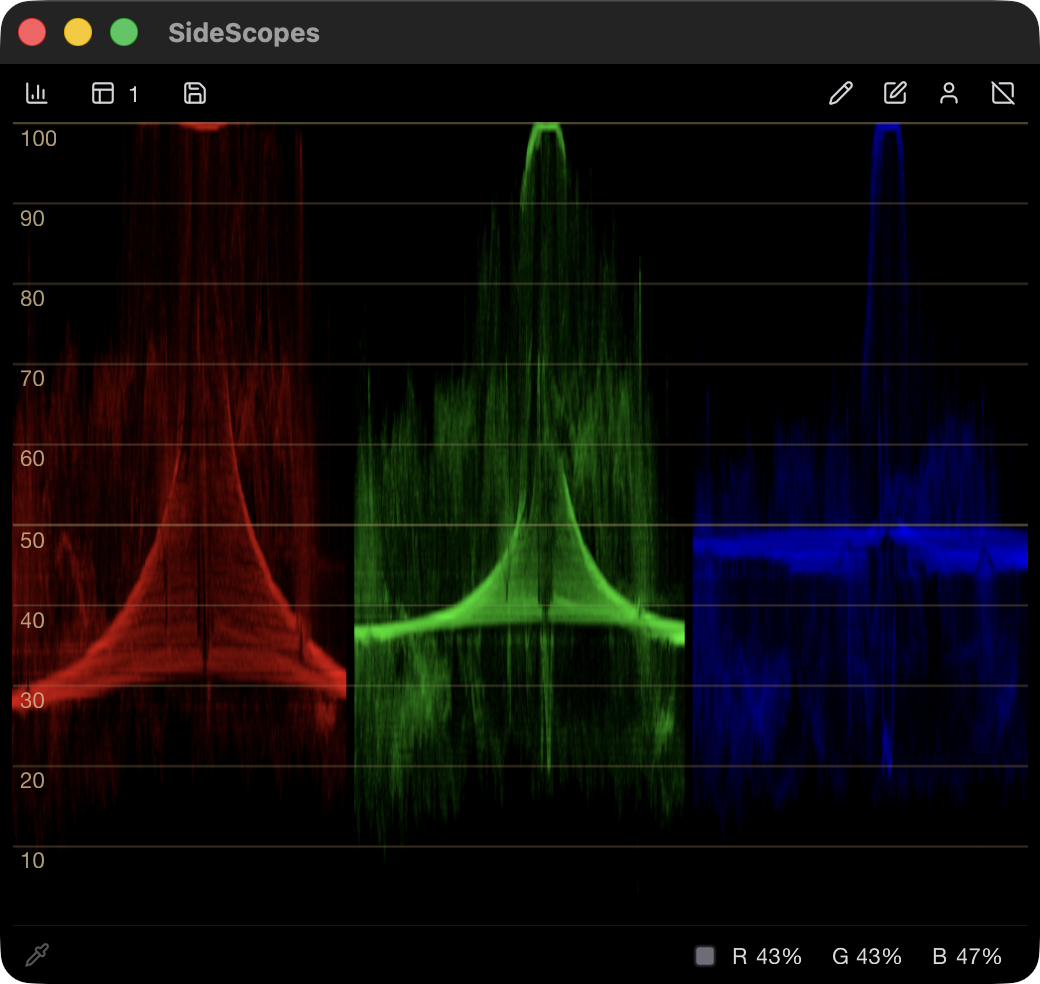
RGB Parade
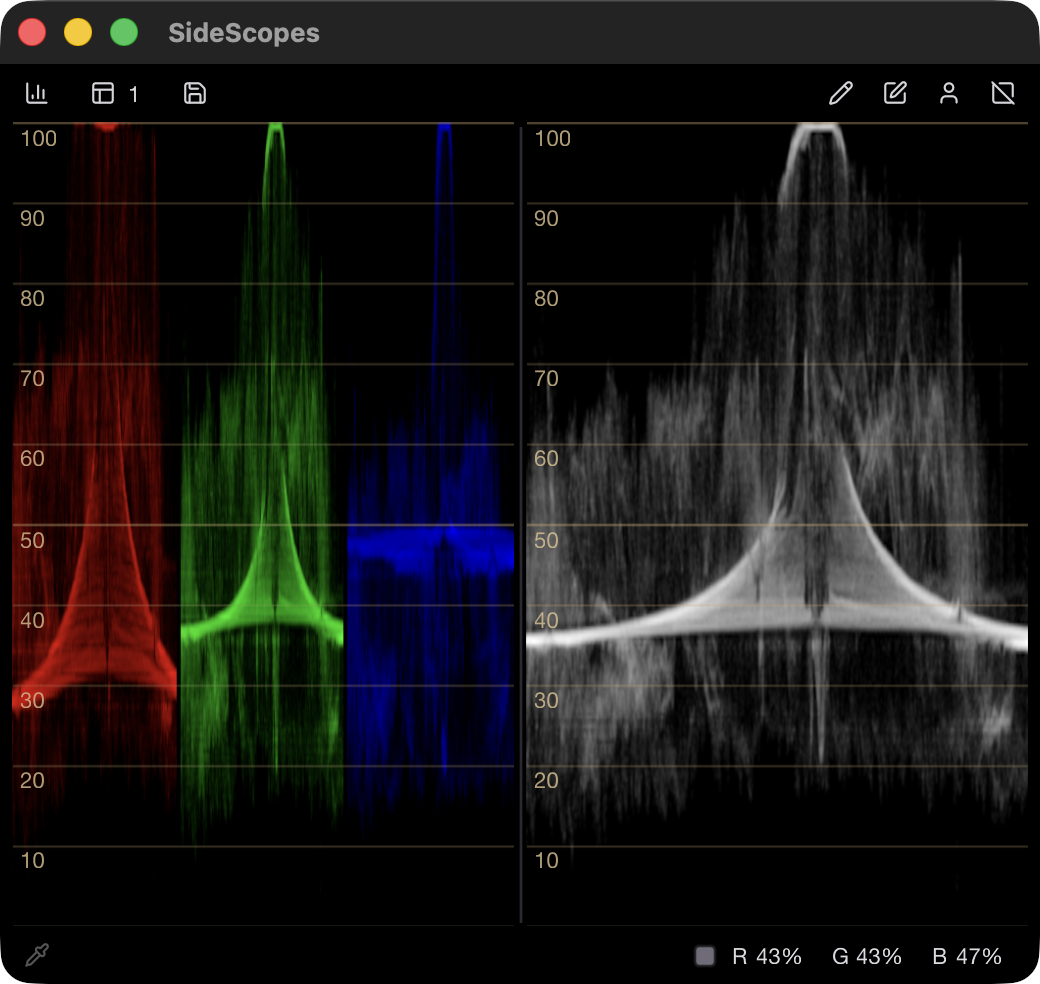
Separates red, green, and blue into adjacent waveforms for direct channel comparison.
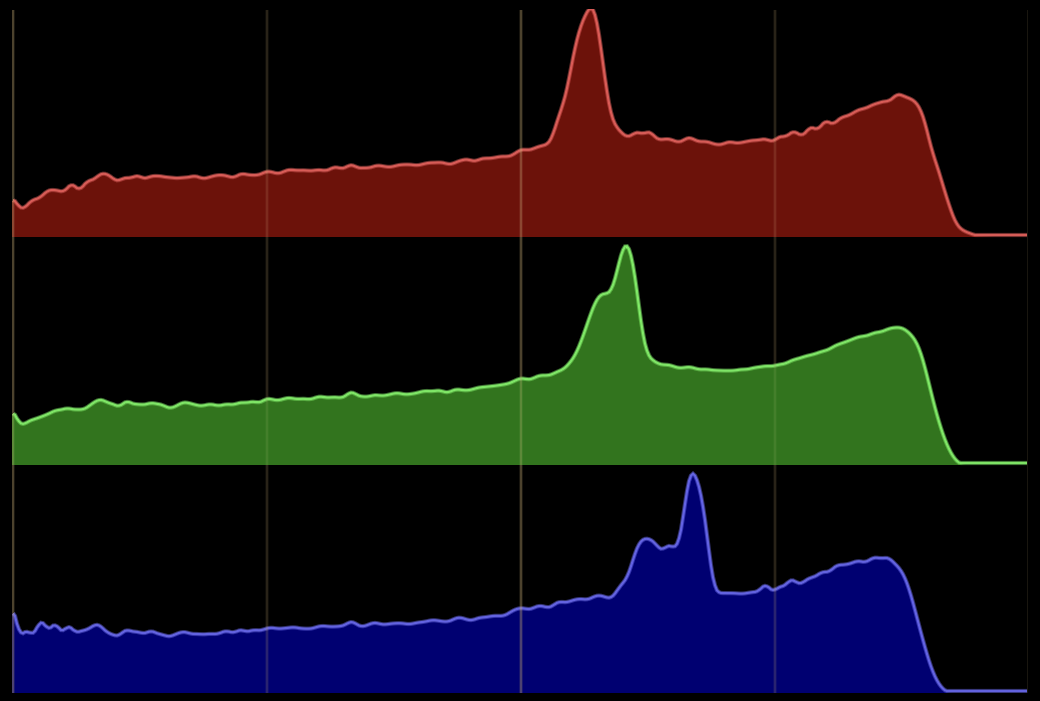
Histogram
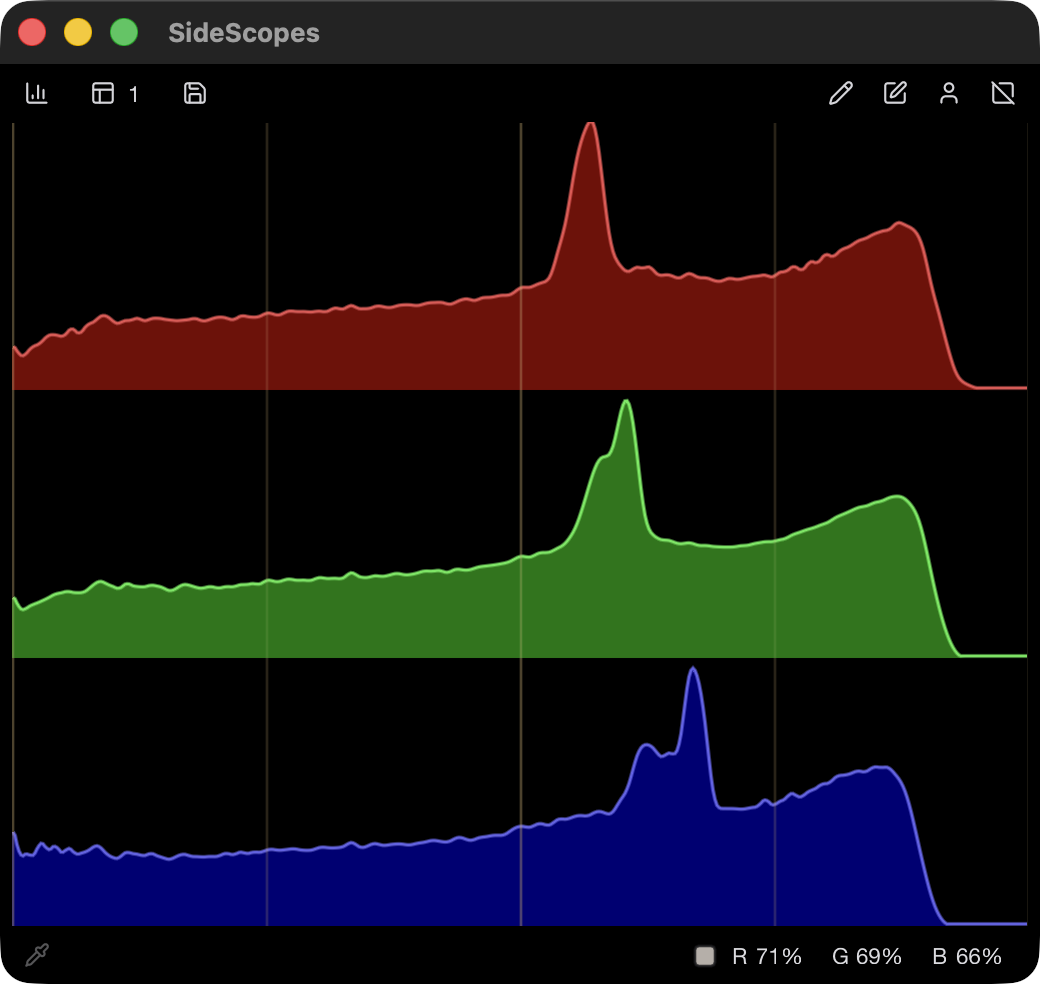
Counts captured channel values without retaining where they occur in the image.
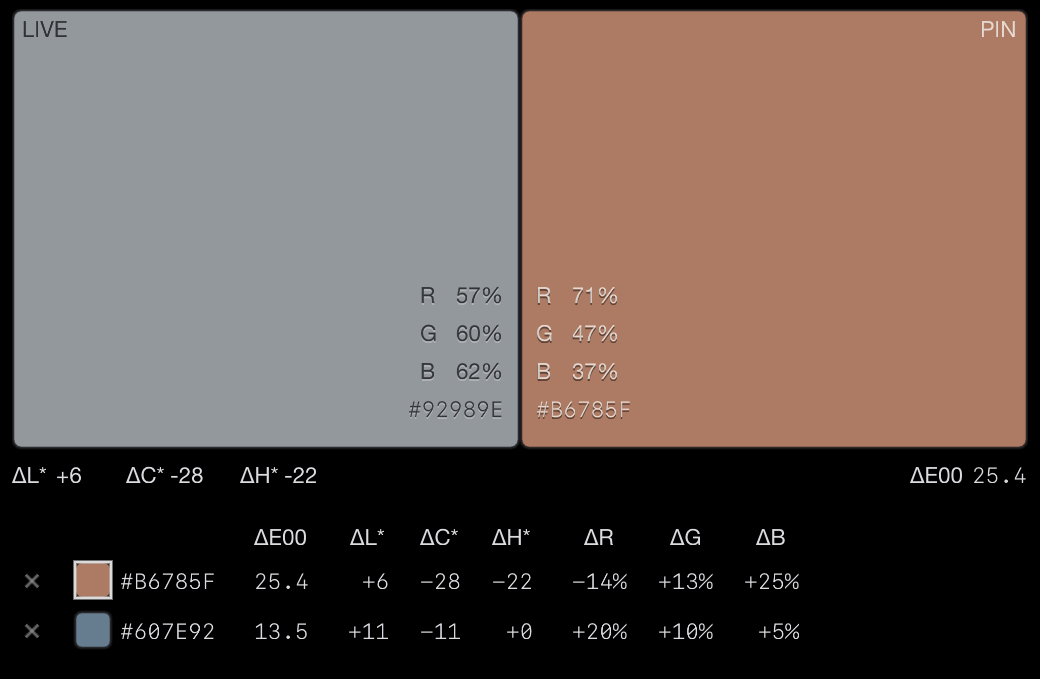
Color Picker
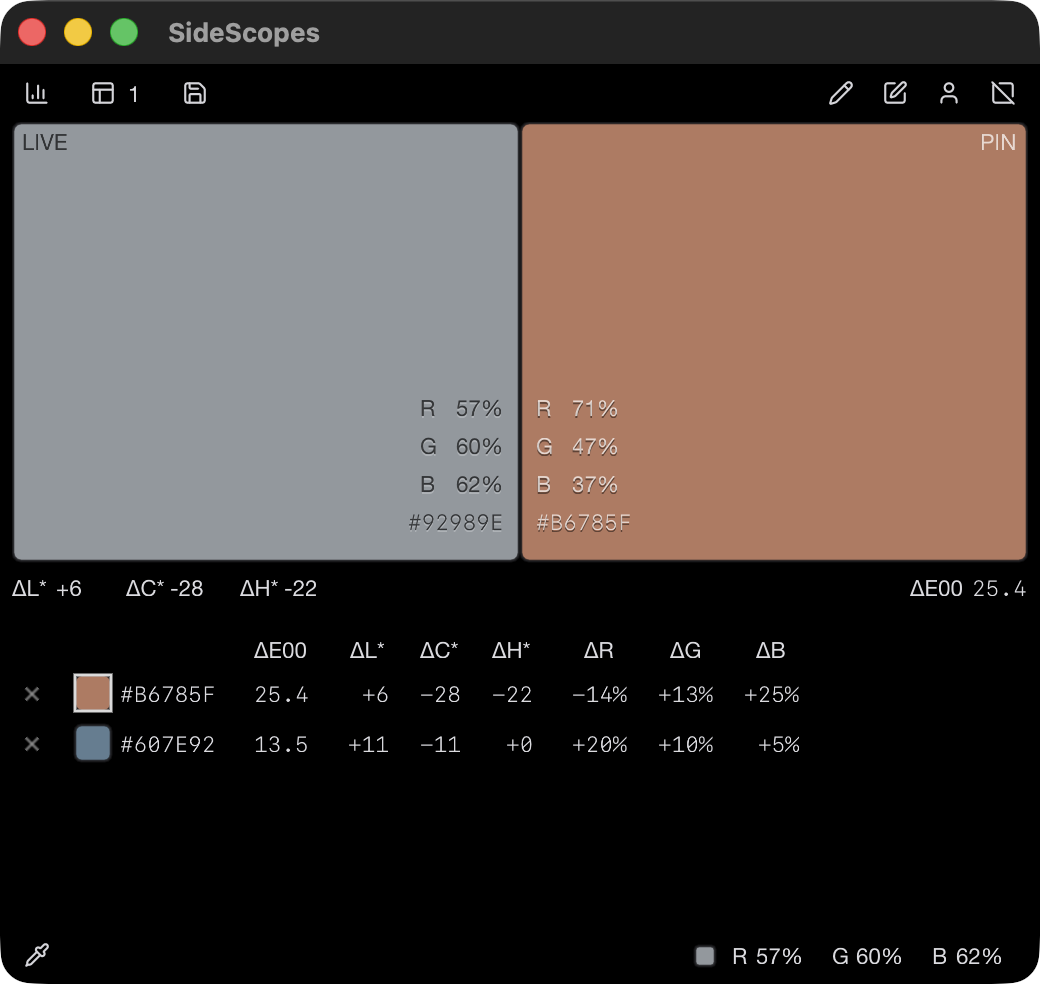
Samples live and pinned colors, reporting RGB values and CIEDE2000 differences under an sRGB assumption.
Change an image and watch the scopes respond
The Interactive Lab runs the application’s scope engines in your browser. Start with a supplied image or load your own, select a region, and adjust color and tone while the traces update.
The adjustment controls are designed for observation and teaching; they do not reproduce the processing of any particular editor. Images you load remain in your browser.
Desktop and Lab
The Lab analyzes still images inside its page. The desktop application measures other applications and keeps editable regions visible on the desktop. Regions can stay fixed to a display or follow a window; face selection sets the initial crop within a window.
Display-referred, SDR measurements
SideScopes measures pixels after the source application and operating system have rendered them to the screen. It does not inspect source media, timeline values, RAW data, or exported files, and it is not an ICC soft-proofing or source-signal compliance tool.
This boundary matters when interpreting clipping, gamut, white balance, and color-difference readings. The learning pages state the relevant conditions alongside each reading.
10-bit precision and HDR highlights
Ten-bit capture preserves rendered gradient steps when the source application and desktop provide them.
The desktop application is being developed with Windows Advanced Color capture and HDR Luminance on supported Mac and Windows systems. See highlights in stops above SDR white, together with their peak and share of the region. The browser Lab remains SDR.
Coming soon
SideScopes for macOS and Windows is in development.
Explore the instruments in SideScopes Lab or read the learning guides.